
Table of Contents
- The Problem with Manual SQL
- What Is an AI SQL Generator?
- Common Use Cases
- Manual Approach: Writing SQL Yourself
- Using an AI SQL Generator in Canvas
- When This Approach Works Best
- Getting Started
The Problem with Manual SQL
Analytics data rarely comes in the format you need. Specifically, GA4 exports combine values that you need separated (like sessionSourceMedium), use date formats that don’t match your reports, or include data ranges you don’t want. That’s where an AI SQL generator can help you quickly transform exported data for your analysis.
Common transformation tasks:
- Split combined columns into separate fields
- Filter data to specific date ranges
- Reformat date strings for reporting tools
- Categorize values into groups
- Create calculated fields
Each task requires writing SQL. Furthermore, each SQL statement needs testing, debugging, and maintenance when your data structure changes. For a single transformation, this is manageable. In contrast, managing dozens across multiple data sources becomes a bottleneck.
What Is an AI SQL Generator?
An AI SQL generator converts natural language descriptions into SQL code. Instead of writing:
SELECT
  SPLIT(sessionSourceMedium, ' / ')[OFFSET(0)] AS source,
  SPLIT(sessionSourceMedium, ' / ')[OFFSET(1)] AS medium,
  *
FROM your_table
You describe what you want: “Split sessionSourceMedium into two columns: source and medium.”
Then the AI generates the SQL. You review it, run it, and move on.
Key benefits:
- No syntax memorization required
- Faster iteration on transformations
- Lower barrier for non-SQL users
- Consistent output formatting
Important caveat: AI-generated SQL should always be reviewed before running on production data. The AI interprets your intent, but you verify the output.
The Analytics Canvas platform is a data-prep tool for marketers, designed for data extraction, exploration, and automation without writing code. Sign-up for a free trial or connect with our team for a demo and discussion about how to enhance your Google Search Console reporting.
Common Use Cases
Indeed, based on how our users transform GA4 data, here are the most frequent scenarios:
| Use Case | Natural Language Prompt | What It Does |
|---|---|---|
| Column splitting | “Split sessionSourceMedium into source and medium columns” | Separates combined fields |
| Date filtering | “Show only data from March to June” | Filters to date range |
| Value categorization | “Group sources into Paid, Organic, and Direct” | Creates category column |
| Date reformatting | “Convert date from YYYYMMDD to YYYY-MM-DD” | Standardizes date format |
| Null handling | “Replace empty values with ‘not set'” | Cleans missing data |
These represent 80% of the transformations analysts need. Consequently, they’re the scenarios where this approach provides the most value.
Manual Approach: Writing SQL Yourself
Before showing the Canvas approach, let’s walk through the manual method. This is what you’d do in BigQuery, any SQL client, or a data transformation tool.
Example 1: Split sessionSourceMedium
GA4’s sessionSourceMedium combines source and medium with ” / ” as a delimiter. To split it:
BigQuery SQL:
SELECT
  SPLIT(sessionSourceMedium, ' / ')[SAFE_OFFSET(0)] AS session_source
  SPLIT(sessionSourceMedium, ' / ')[SAFE_OFFSET(1)] AS session_medium,
  sessions,
  totalUsers
FROM `your_project.your_dataset.your_table`
What you need to know:
- SPLIT() function syntax for your SQL dialect (see BigQuery string functions)
- SAFE_OFFSET vs OFFSET (handles nulls differently)
- Whether to include original columns or just transformed ones
Example 2: Filter to Date Range
To show only data from March through June 2025:
BigQuery SQL:
SELECT *
FROM `your_project.your_dataset.your_table`
WHERE date BETWEEN '2025-03-01' AND '2025-06-30'
What you need to know:
- Your date column’s format (string vs DATE type)
- Whether to use BETWEEN, >=/<=, or DATE() functions
- Time zone considerations for your data
Both examples are straightforward for experienced SQL users. Nevertheless, they require knowing the exact syntax, and small errors create silent failures or incorrect results.
Using the AI SQL Generator in Canvas
Analytics Canvas includes a Data Transformer block that accepts natural language prompts. Here’s how it works.
Step 1: Add a Data Transformer Block
After connecting your data source (GA4 API, BigQuery, or file), add a Data Transformer block to your canvas.
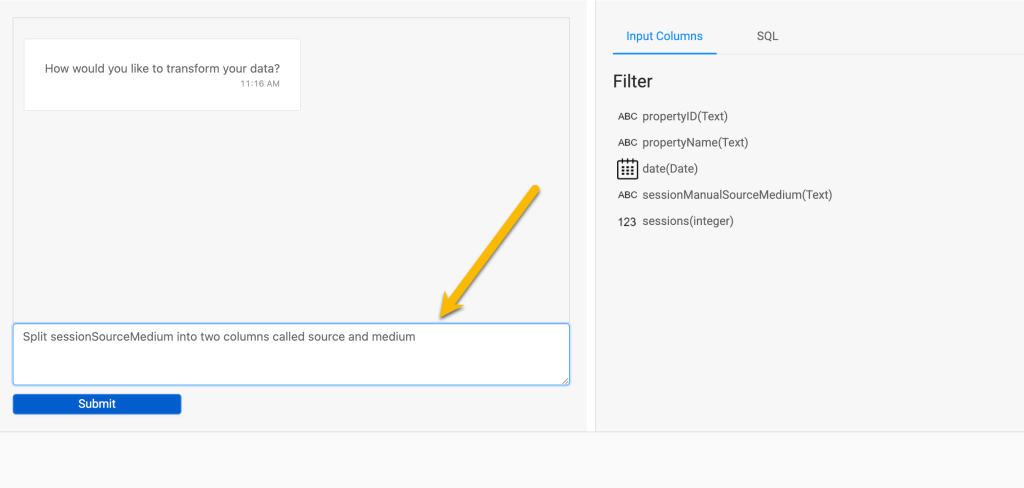
Step 2: Describe Your Transformation
In the prompt field, describe what you want in plain English:
“Split sessionSourceMedium into two columns called source and medium”
Step 3: Review Generated SQL
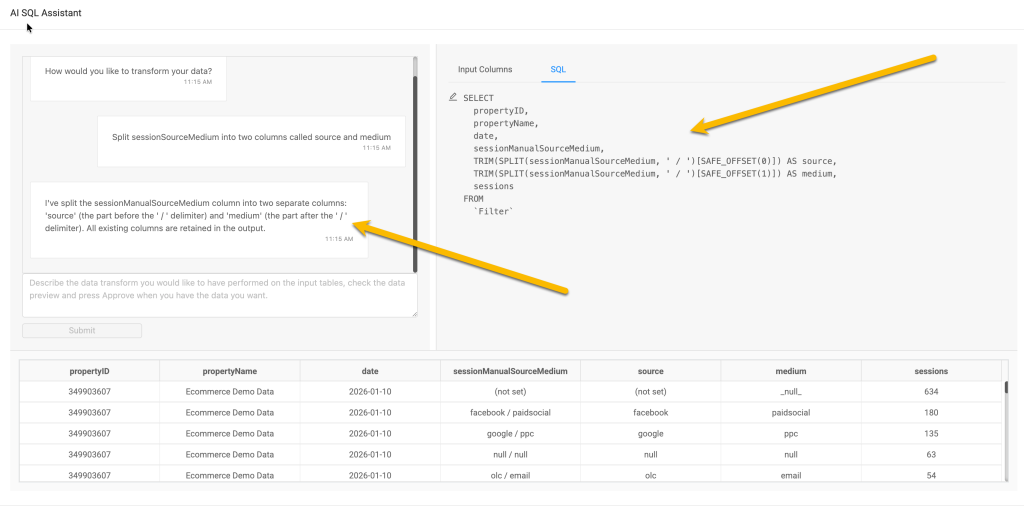
The AI generates SQL based on your prompt. For the split example, you’ll see something like:
SELECT
  propertyID,
  propertyName,
  date,
  sessionManualSourceMedium,
  TRIM(SPLIT(sessionManualSourceMedium, '/')[SAFE_OFFSET(0)]) AS source,
  TRIM(SPLIT(sessionManualSourceMedium, '/')[SAFE_OFFSET(1)]) AS medium,
  sessions
FROM
  `Filter`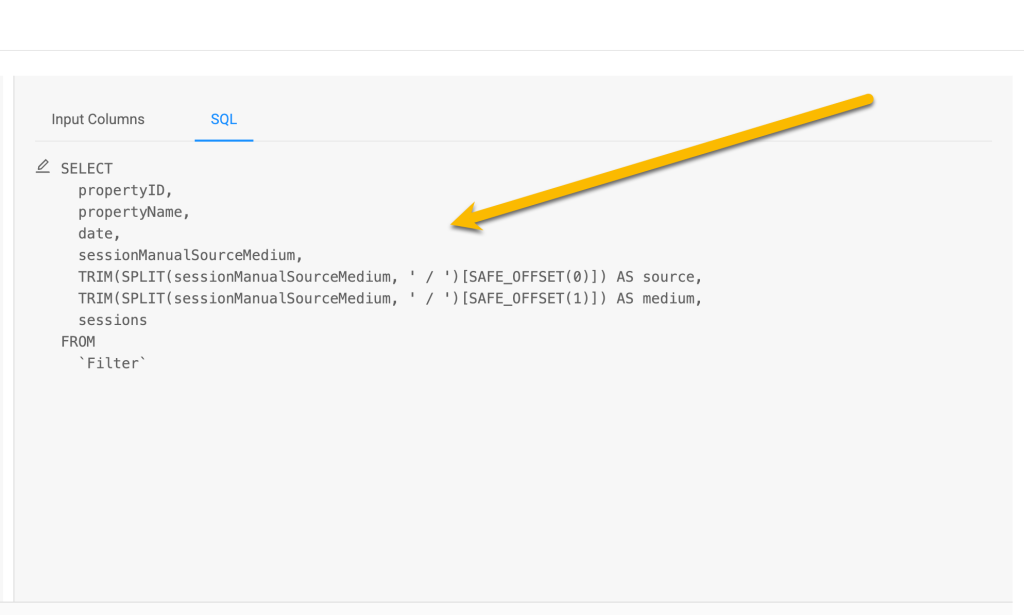
Step 4: Preview and Run
Click Preview to see the transformation applied to sample data. If it looks correct, run it.
Date Filtering Example
Similarly, for date filtering:
“Show data between March and June 2025”
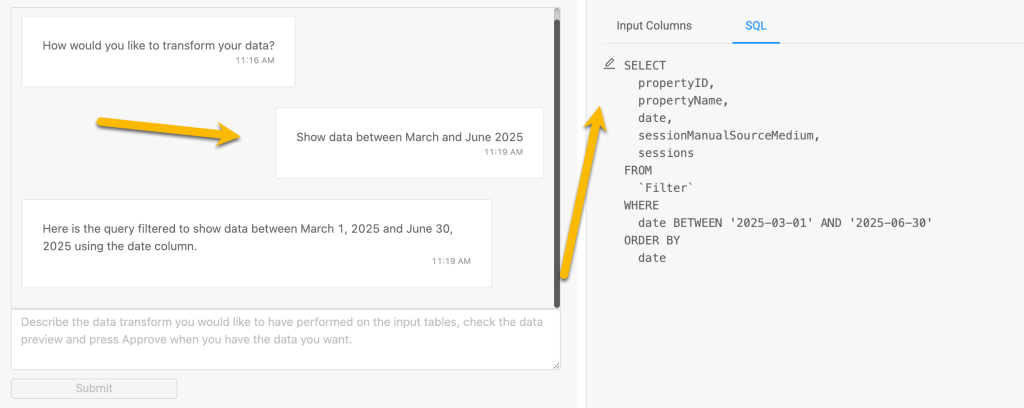
Generated SQL:
SELECT
  propertyID,
  propertyName,
  date,
  sessionManualSourceMedium,
  sessions
FROM
  `Filter`
WHERE
  date BETWEEN '2025-03-01' AND '2025-06-30'
ORDER BY
  date
The difference: You described the outcome. The AI handled the syntax.
The Analytics Canvas platform is a data-prep tool for marketers, designed for data extraction, exploration, and automation without writing code. Sign-up for a free trial or connect with our team for a demo and discussion about how to enhance your Google Search Console reporting.
When This Approach Works Best
This type of tool excels at routine transformations on structured data. Specifically:
Good fit:
- Column splitting and combining
- Date range filtering
- Simple value mapping
- Format conversions
- Basic aggregations
Less ideal:
- Complex multi-table joins
- Advanced window functions
- Highly custom business logic
- Performance-critical queries on large datasets
For complex transformations, you may want to write SQL directly. Alternatively, use the AI output as a starting point and refine it manually.
Current status: The Data Transformer handles simple transformations reliably. We’re expanding its capabilities for more complex scenarios in upcoming releases.
Getting Started
This feature is available now in Analytics Canvas.
If you’re already a Canvas user:
- Add a Data Transformer block to any canvas
- Enter your natural language prompt
- Review the generated SQL
- Preview and run
If you’re evaluating Canvas: The Data Transformer is part of our Q1 2026 update, alongside BigQuery output options and new connectors.
Next Steps
Whenever you’re ready… here are 3 ways Canvas can help:
- Extract data from all your properties using the API or BigQuery without writing code
- Profile, analyse, and prepare data for reporting
- Maintain your GA4 data warehouse within Analytics Canvas Online or your own DB
Ready for the next step?
- Start an instant 30 day risk-free trial. No credit card or sales call required.
- Schedule a demo for you and your team.
- Contact us to discuss plans and pricing or activate your subscription.
Wondering if Canvas is right for you? Check out the related articles to learn more about our Data Studio Partner connector. Questions? Reach out to support@analyticscanvas.com