
Introduction
One powerful feature in Google Analytics 4 (GA4) is the Funnel Exploration tool. This tool allows you to analyze user behavior by creating segments based on specific actions. In a Funnel Exploration, a segment in GA4 is a defined series of steps that users take within a session. These steps can lead toward a conversion or key event. This exploration is particularly valuable for ecommerce stores, to understand user behavior at each step of the funnel and can highlight areas of success or potential drop-off.
Here is an an example of a typical GA4 Ecommerce Segment in a funnel exploration:
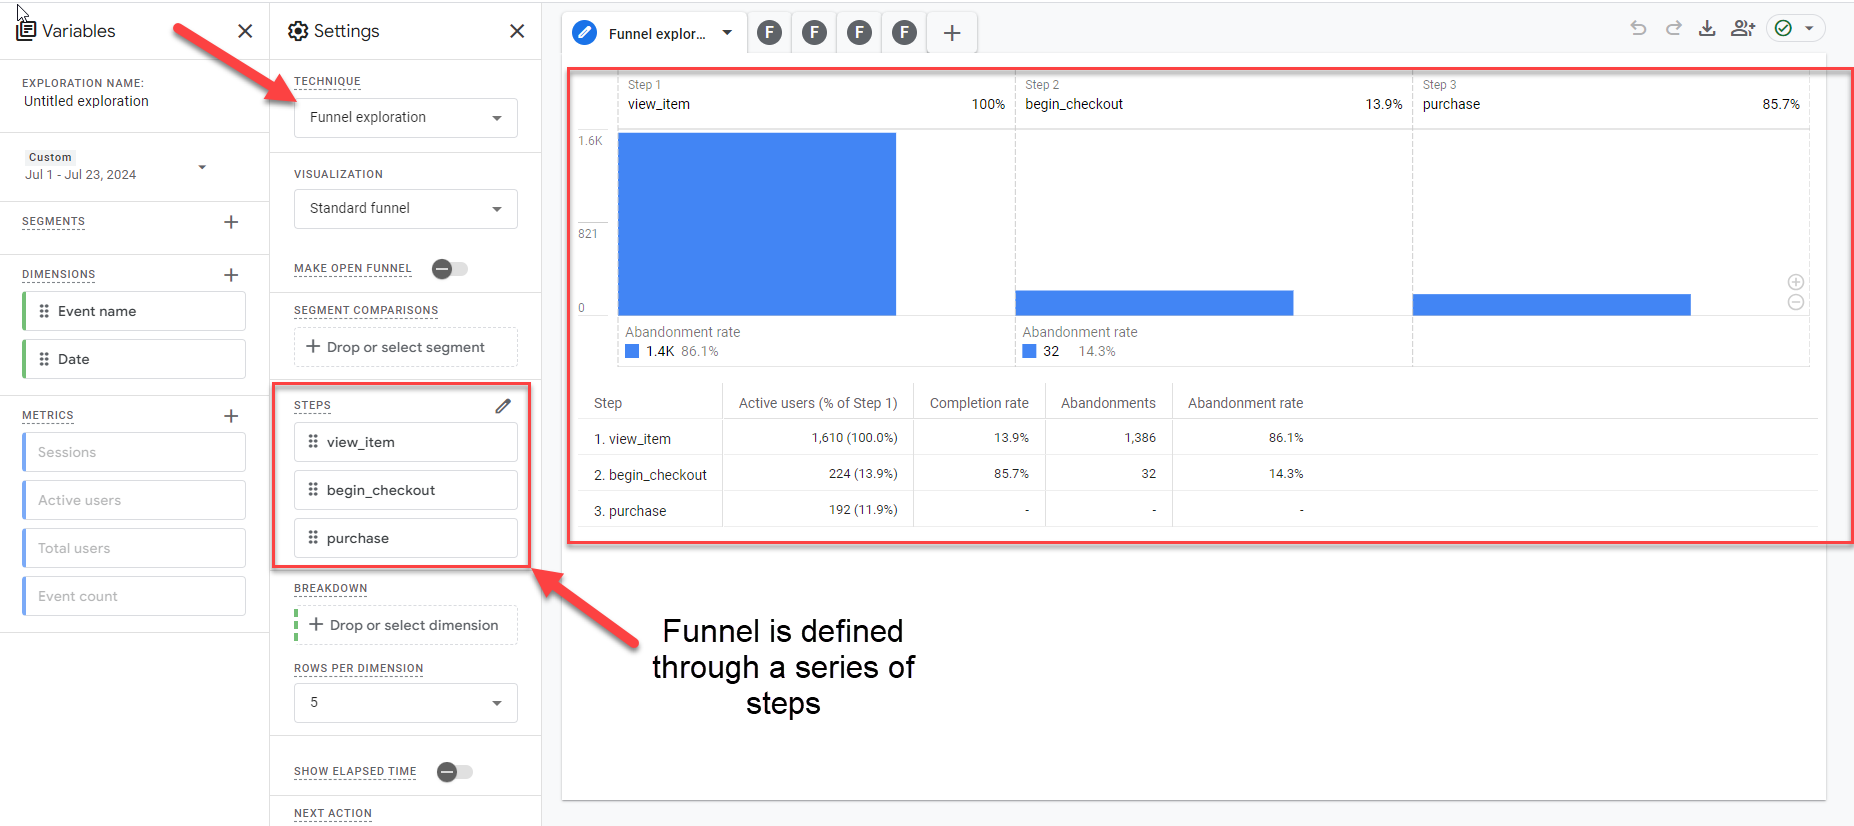
As useful as these Exploration reports are, they can be subject to the 14-month data retention limitation. Additionally, they may be subject to data sampling, data thresholding, and/or data cardinality. Furthermore, this functionality is currently not available through the GA4 Data API or in the GA4 BigQuery export. This makes it difficult for those who want to access and build these reports outside the Google Analytics 4 web interface.
In this post, I’ll demonstrate how to build GA4 ecommerce segments and develop funnel reports using the GA4 BigQuery Export and Analytics Canvas. By using this approach, you’ll overcome the limitations of data retention, sampling, and thresholding. One final note, is you can build this solution without Analytics Canvas, however you will need a basic understand of SQL or have a similar tool.
After building our table, in Analytics Canvas, the resulting data can be visualized in tools like Looker Studio, Tableau, Power BI, or any other reporting tool, providing you with a flexible and robust way to present insights to stakeholders.
Segments in GA4
GA4 has three types of segments:
- User segments
- Session segments
- Event segments
This post focuses on session segments. Which means we are only counting the sessions where a user completed a series of GA4-tracked steps in a specific order.
For example, think of a ecommerce funnel with the following steps:
- Step #1 – View an Item
- Step #2 – Begin Checkout
- Step #3 – Purchase
For these steps the segments are as follows:
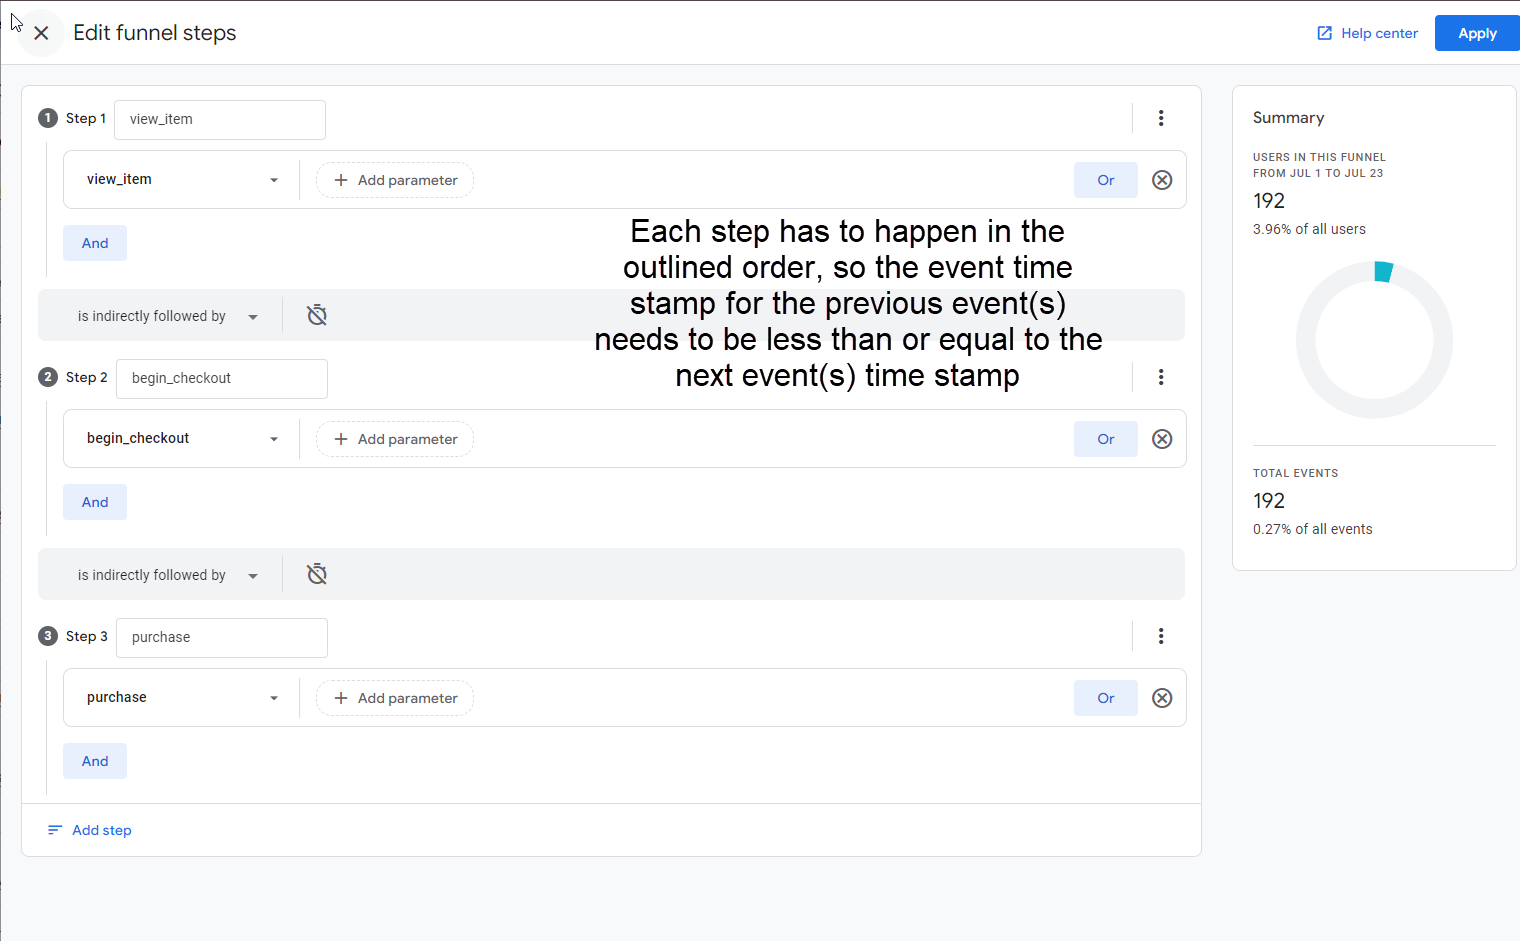
- Step #1 – View an Item – happens before begin checkout and purchase (happens first)
- Step #2 – Begin Checkout – happens after view an item and before purchase
- Step #3 – Purchase – happens after view an item and after checkout
In GA4 Exploration you would define your funnel exploration steps as follows:
Requirements for Building a Session Segment using GA4 BigQuery
To build Session Segments, you will need the following pre-requisites:
- GA4 BigQuery Event Export – you need your GA4 data in BigQuery using the native connection. Learn about [GA4] BigQuery Export.
- Events for each step of your funnel – for example for the ecommerce funnel we will use the following three events:
- Step #1 – view_item
- Step #2 – begin_checkout
- Step #3 – purchase
Note – you are not limited to three events, your funnel could have any number of events.
Session Segment Build Strategy
To build a session segment based on steps tracked in Google Analytics 4, you need a query that creates the dataset. It must include the necessary fields and have the right level of granularity and scope.
Building a session segment requires event data, including event name and time. You also need the unique Session ID and session-scoped dimensions like Session Source, Medium, and Campaign. You can also include Session Term, Content and Landing Page, or other session-level dimensions.
Here is an example of the SQL query using Analytics Canvas. While you can write the SQL yourself, the query builder lets us focus on creating segments without dealing with SQL. The following example uses the Google Analytics 4 BigQuery Event Export connector to build our first query:
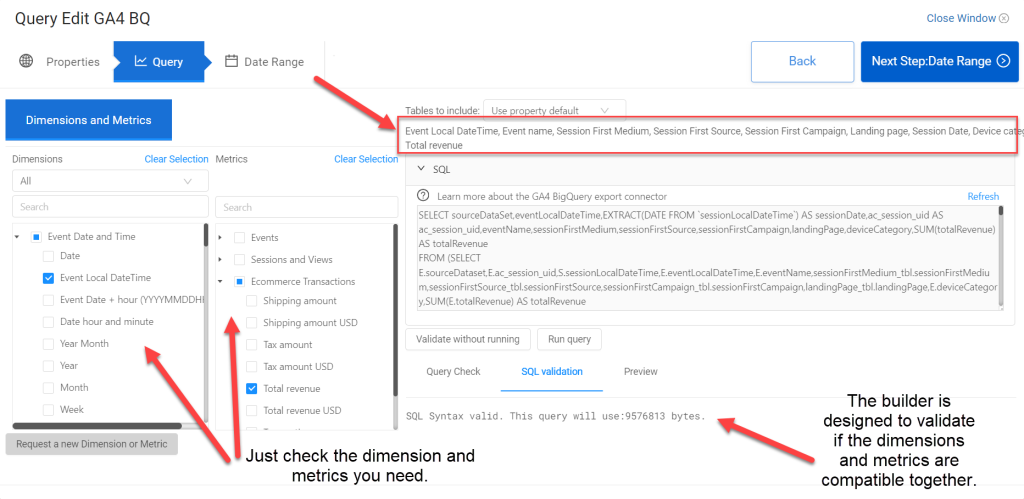
In this query, we are including the following dimensions:
- Event Local DateTime – time the event was written to GA4
- Event name – event name
- AC Session UID – string that pulls together the
user_pseudo_idandsession_idfor a single user for a single session - Session First Medium – first medium for that session, you can use max medium too if desired
- Session First Source – first source for that session, you can use max source too if desired
- Session First Campaign – first campaign for that session, you can use max campaign too if desired
- Session Date – date a session occurred on
AC_Session_ID is the concatenated user_pseudo_id and session_id. This approach is recommended by Google for counting sessions to ensure you are only counting unique session across users.
Defining and Isolating the Events that form the Funnel Steps
Once you have the data, filter it to include only the events for each step in your funnel. For example, the three steps for our ecommerce funnel are:
- Step #1 – view_item
- Step #2 – begin_checkout
- Step #3 – purchase
This can be done in SQL, or within Analytics Canvas, using a Filter block. A filter is a step in the workflow that lets you use an expression in spreadsheet syntax or BigQuery SQL to filter data.
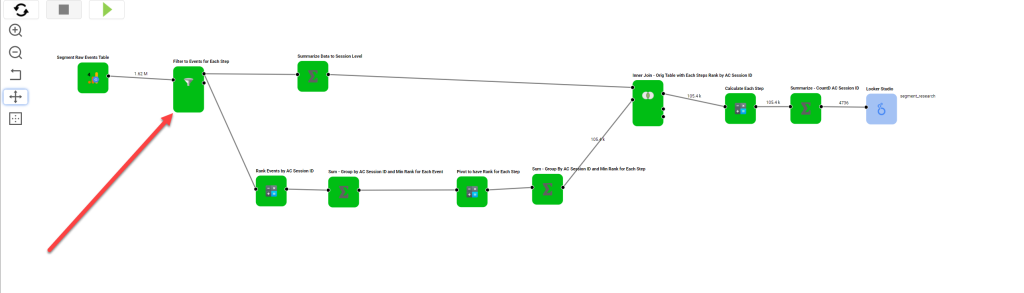
Below is the configuration for our Filter block.
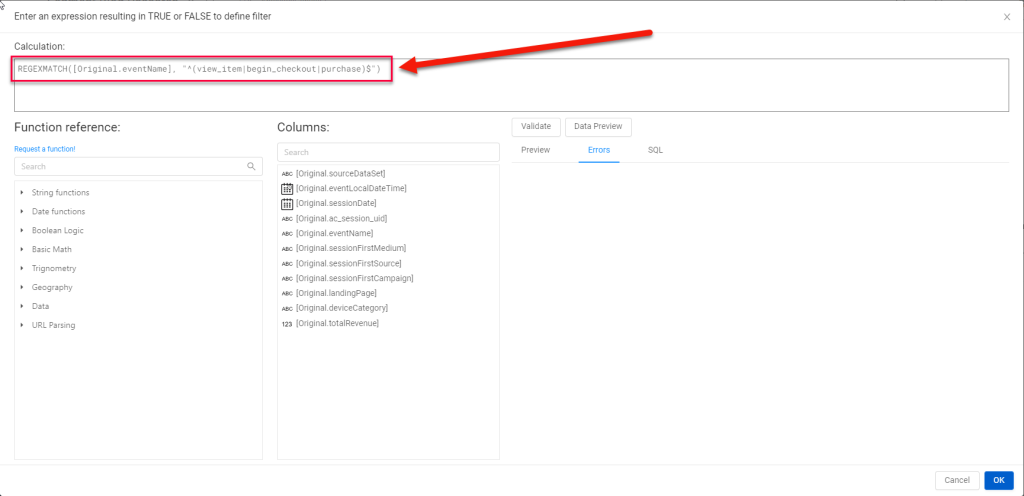
Note: We use regular expressions in the filter. To learn more about regular expressions, see Syntax for Regular Expressions.
The Expression used above is a “REGEXMATCH”. It can be written as follows:
REGEXMATCH([Original.eventName], "^(view_item|begin_checkout|purchase)$")The expression can also be written using a ‘contains’ approach. However, be cautious as ‘contains’ expressions use substring matching, which might include unintended events.
CONTAINS([Original.eventName], "view_item", "begin_checkout", "purchase") At this point, we have filtered the data down to just the events in our segment.
Ranking the Funnel Events within Each Session
The next step is to rank the steps within a session to order them. Using a Calculate block, we going to add a column named stepRank. This column will be a Calculated Field and in it we will use a POWERFUL SQL function named RANK.
The RANK function will rank the events in ascending order by eventLocalDateTime, with the table partitioned by AC Session UID. Basically you are ranking the events in order for each individual session a user has in the data.
The following formula will rank events in order within a session:
RANK() OVER (PARTITION BY `ac_session_uid` ORDER BY `eventLocalDateTime` ASC )Your Calculate block will appear as follows with the new Calculated Field:
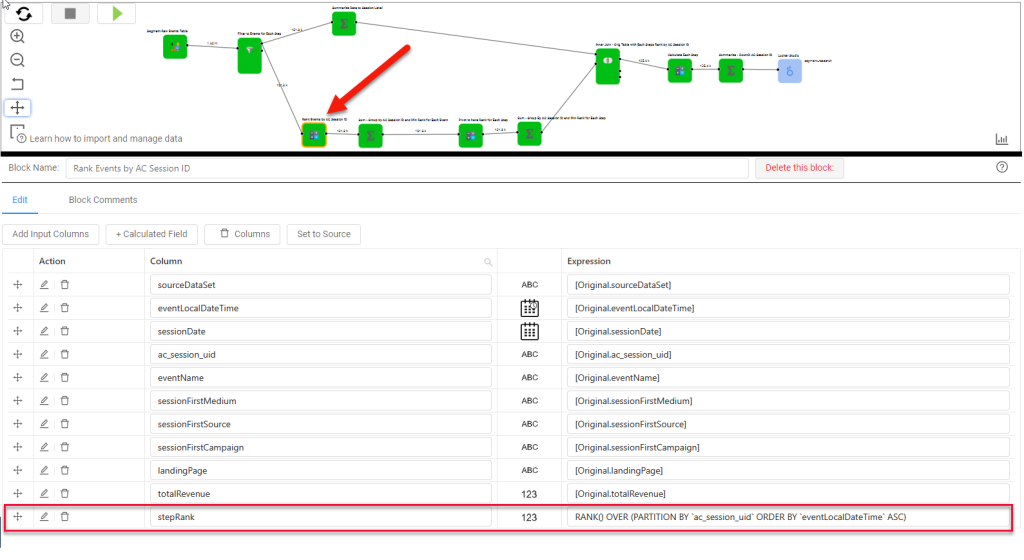
Now we have to remember that users can perform behaviors multiple times in a session, so you only want to capture and count the first of each behavior (event) a user performs in a single session.
Finding the First of each event within each session
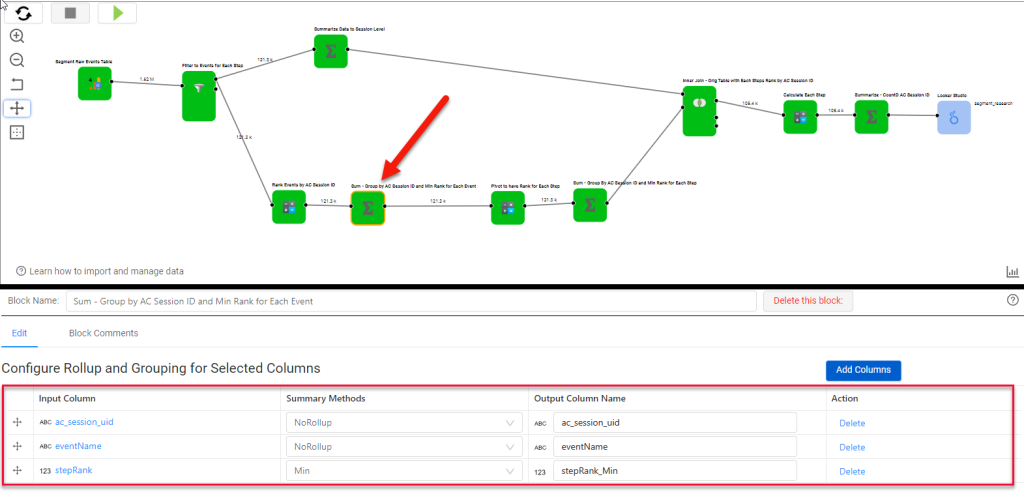
Now to only capture and count the first of each behavior (event) a user performs in a single session, we need to perform some grouping. To perform this grouping we will use a Summarize block. The Summarize block will group the data by minimum rank for each event per ac_session_uid. This will get us to only have the first of each behaviour a user performed in a session.
Drag and drop the Summarize block onto the Canvas and connect it to the Calculate block from the previous step. Select only the columns needed: ac_session_uid, eventName and stepRank. Then under the summary method, select MIN for stepRank. See the configuration of the summarize block below.
Pivoting the Funnel Step Fields into Columns
Next you will pivot the table such that for each event of the funnel you have a column indicating its rank for a single AC Session UID. We’ll do this by clicking “+Calculated Field”, then clicking on the expression to define the name of the column and the expression for the calculated field.
Here is an example of our Calculate block showing the 3 steps ranked:
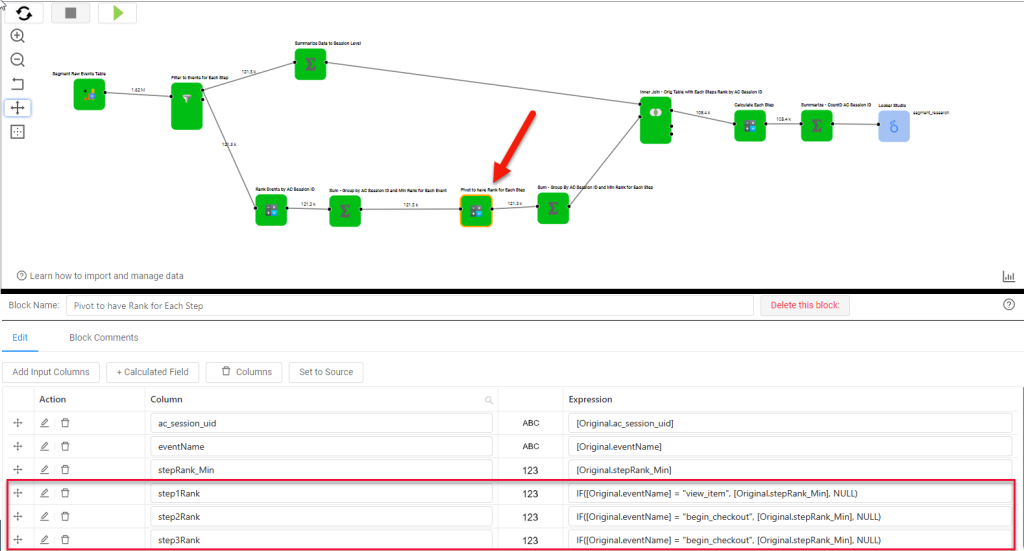
Note: You are not limited to 3 events in your funnel, it can have more events and in that case you will just have more calculated fields here.
The following is the data table post the Calculate block, where we now have the rank for each event in its own column.
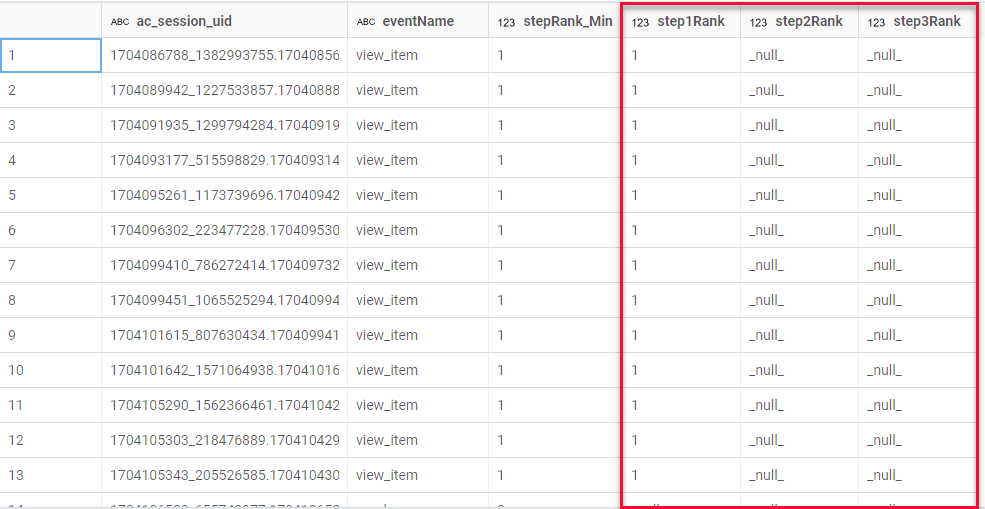
In this output table there are multiple rows for each AC Session UID. In the next section we will reduce this to one row for each AC Session UID with the rank for each event on that single row.
Creating a Table where Each Row is a Unique Session in the Funnel
To summarize the previous table so that we have one row for each AC Session UID, we will connect a new Summarize block, that connects to the calculate block made in the previous step. In this new Summarize block, we are going to group the data by Min for each stepRank column and remove the eventName column.
Here is the summarized block configuration:
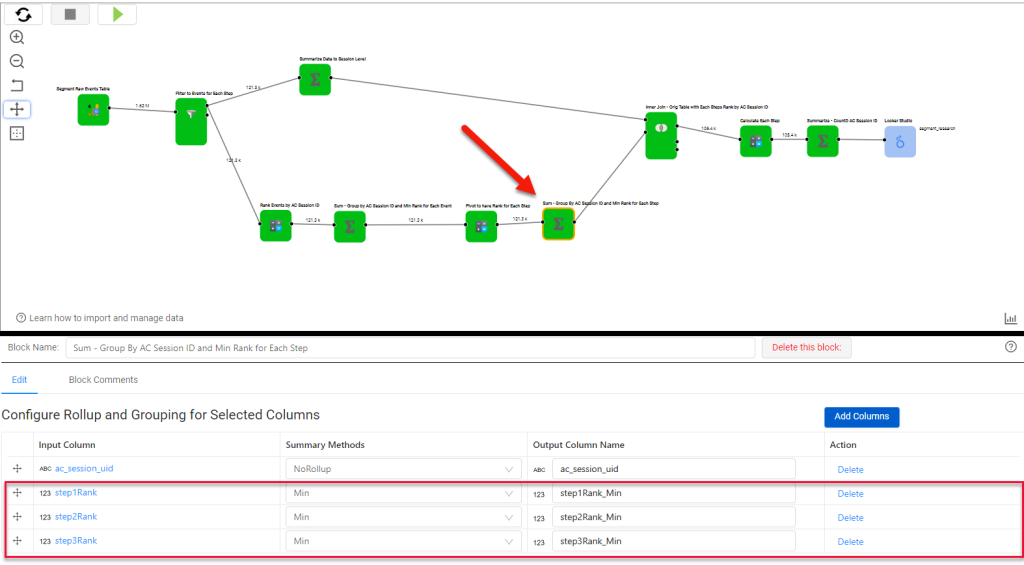
At this stage, your data table, processed by the Summarize block, contains a row for each session, with individual columns showing the rank of each event in your funnel. We’ll call this our Session Funnel Rank Table.
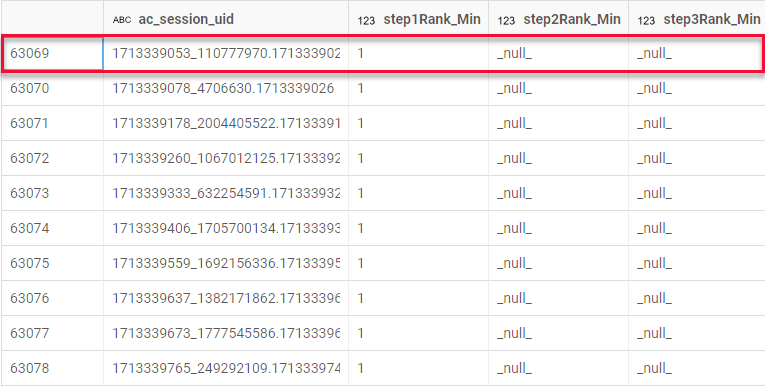
Joining on the Session Segment Table
Now it is time to join this table back with your other session-level dimensions and metrics in our input block. But remember, this table is at the session level now, so before you join this with any other dimensions and metrics you need to ensure those are at the session level too.
To do this, we are going to introduce a Summarize block after the second Filter block, where we summarize our event data so that we have one row for each session instead of one row for each event. Note that we drop eventName from the data in our summarize block. We’ll call this table our Session Dimension Table.
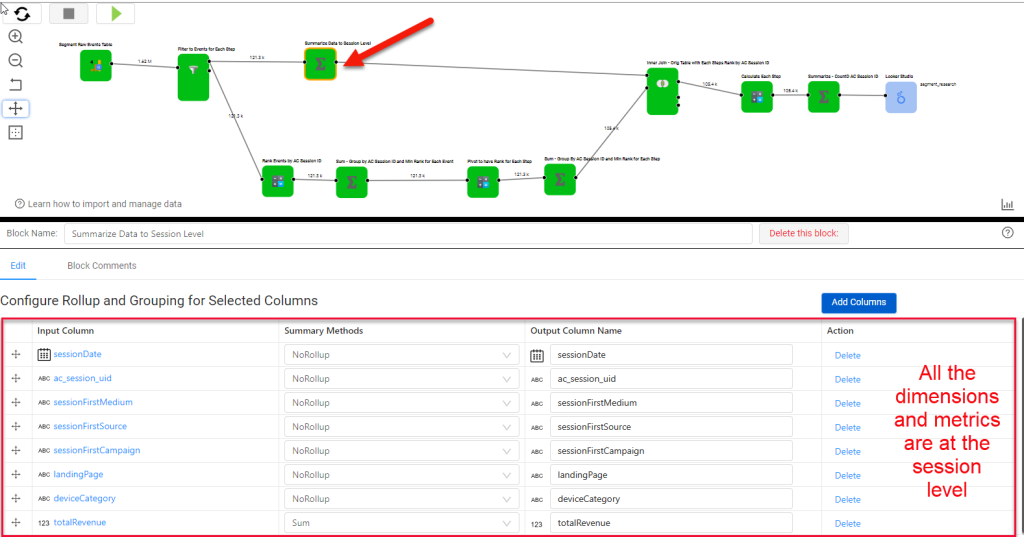
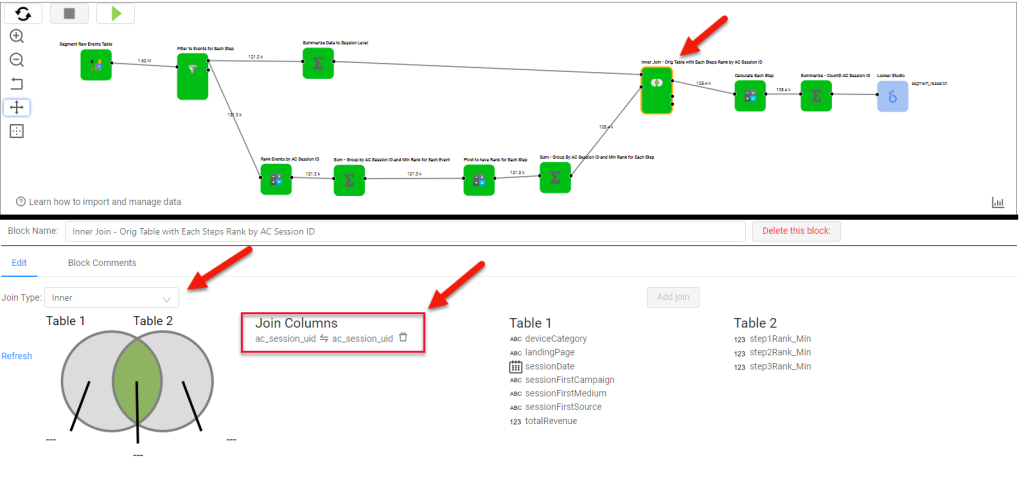
Now it is time to join the Session Funnel Rank Table to the Session Dimension Table. To do this let’s use a Join Block and perform an INNER JOIN. Simply drag and drop the Join block onto the canvas, then connect the two summarize blocks to it. Configure the join by selecting the ac_session_uid field from each table and clicking the “Add Join” button. Learn more about Inner Join at Google support page.
Building the GA4 Ecommerce Segment
Now following the join it is time to build your GA4 Ecommerce Segment for each step, let’s remember our logic from earlier for each step:
- Step #1 – View an Item happens before begin checkout and purchase (happens first)
- Step #2 – Begin Checkout happens after view an item and before purchase
- Step #3 – Purchase happens after view an item and after checkout
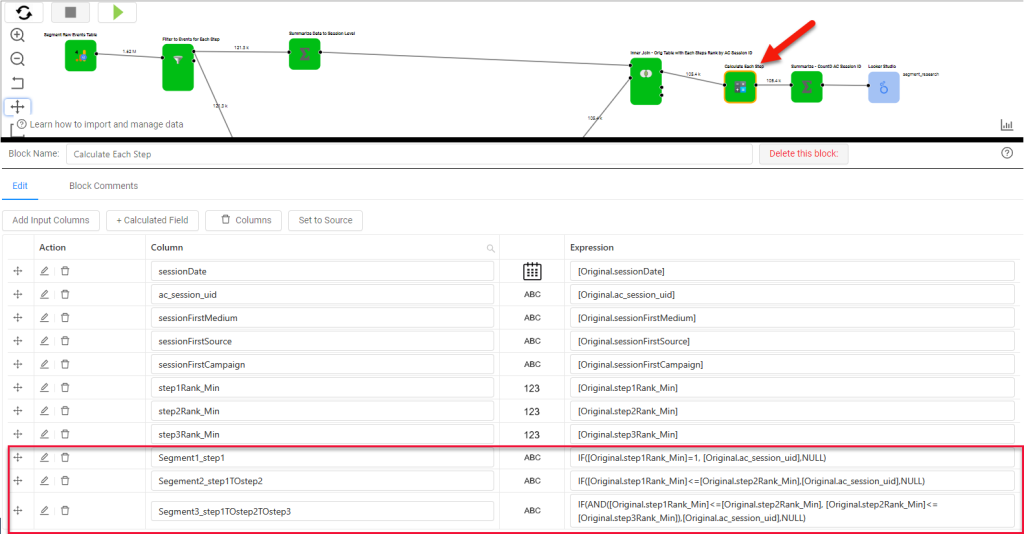
So to define our segments we are going to use the stepRank for each step to determine if the events happened in the required order. We’ll add a calculate block after the join and define our business logic as follows:
- GA4 Ecommerce Segment #1 – will use Step #1 logic, so we need to ensure
step1Rank = 1 (happened first). See calculation below:
IF([Original.step1Rank_Min]=1, [Original.ac_session_uid],NULL)- GA4 Ecommerce Segment #2 – will use the Step #2 logic, so we need to ensure
step1Rank <= step2Rank(ensure step 1 happened before). See calculation below:
IF([Original.step1Rank_Min]<=[Original.step2Rank_Min],[Original.ac_session_uid],NULL)- GA4 Ecommerce Segment #3 – will use the Step #3 logic, so we need to ensure
step1Rank <= step2Rank(ensure step 1 happened before step 2) ANDstep2Rank <= step3Rank(ensures step 2 happens before step 3). See calculation below:
IF(AND([Original.step1Rank_Min]<=[Original.step2Rank_Min], [Original.step2Rank_Min]<=[Original.step3Rank_Min]),[Original.ac_session_uid],NULL)Here is an example of Calculate block with the three segments for our funnel:
Summarizing to Build the Final Table
Now we are done with the stepRank columns as we have our segments. It is time to aggregate the data, by counting distinct AC Session UID in each of the segment columns. This ‘group-by’ can be achieved using another summarize block, where we’ll change the summary method to “Count Distinct” on the columns we just created in the calculate block.

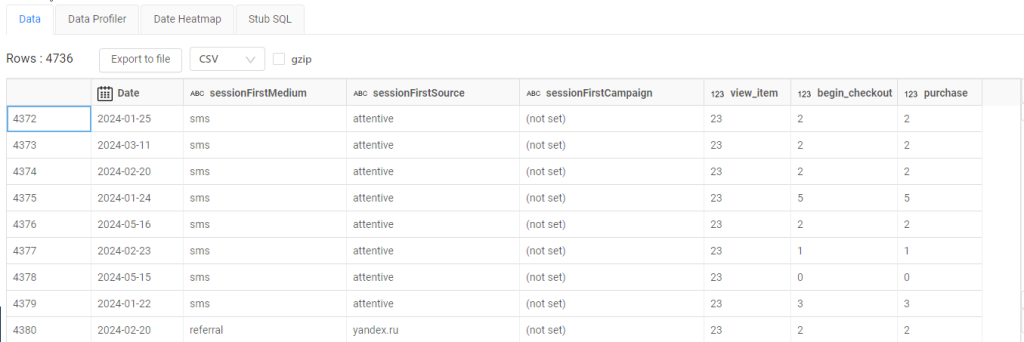
We now have a table that has Session Dimensions for each session where the user performed the funnel steps in the required order, per our logic from earlier:
- Step #1 – View an Item happens before begin checkout and purchase (happens first)
- Step #2 – Begin Checkout happens after view an item and before purchase
- Step #3 – Purchase happens after view an item and after checkout
Here is our final Session Segment Table in Analytics Canvas. It shows that for a specific Date and for a specific Session Source, Session Medium, Session Campaign how many sessions met the logic for Step #1, Step #2 and Step #3.
Outputting the Sessions Segment Table
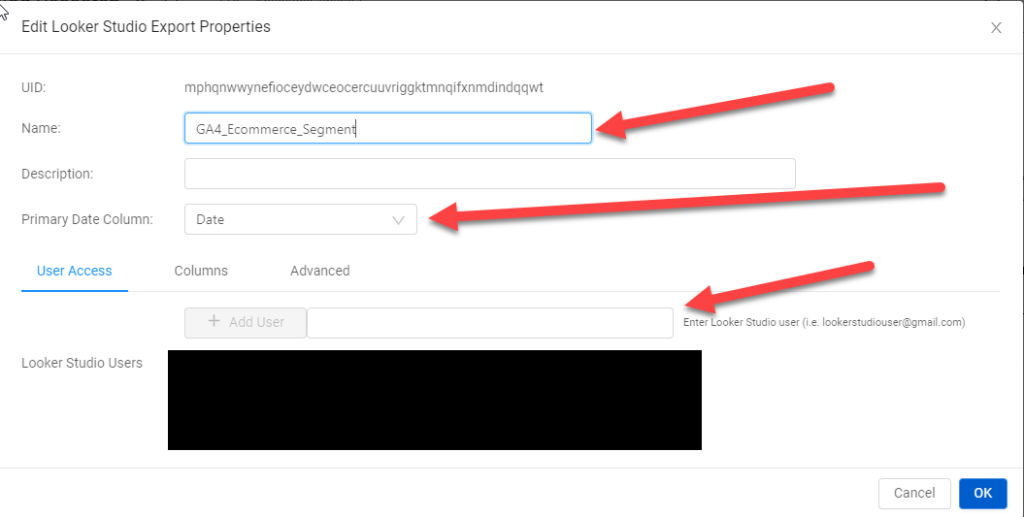
Now that we have our final table it is time to output this table, so we can create a visualization from the Session Segment Table. We are going to build our visualization in Looker Studio, so we can either use the BigQuery export block or the Looker Studio export block to export our data. For this example lets use the Looker Studio export block.
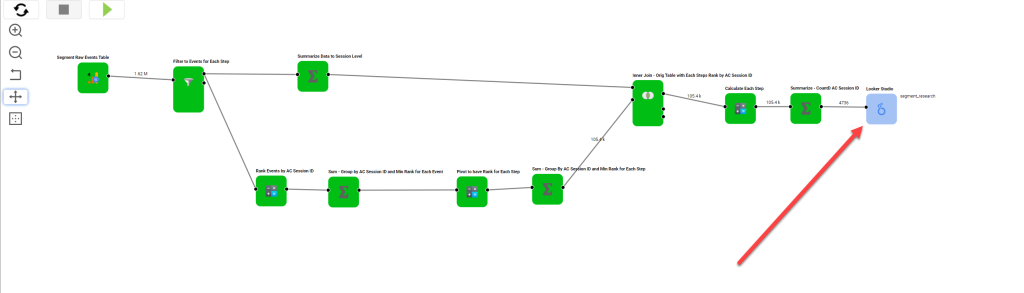
To configure our Looker Studio block, we will give it a name, select our Primary Date Column and add any users who require access.
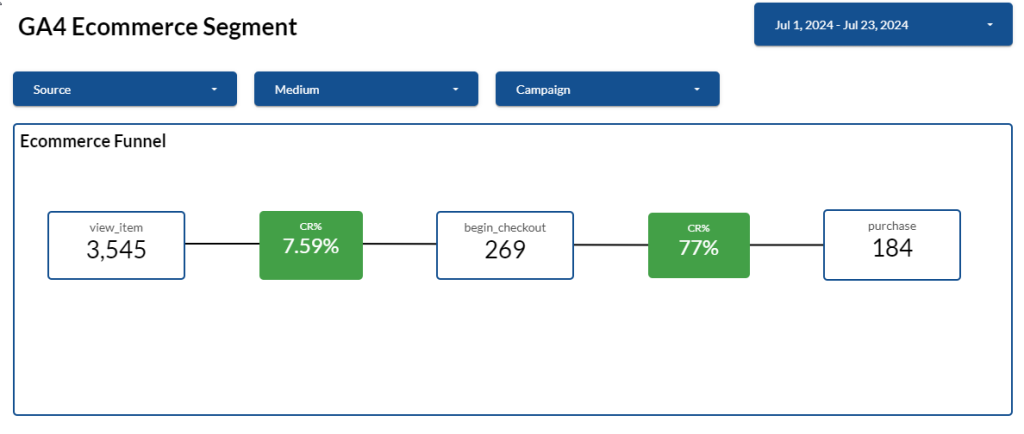
Here is an example of the output table visualized in Looker Studio:
Conclusion
Session segments can be very powerful to help determine how well users are succeeding or failing at each step in your funnel. It is especially useful if your funnel has multiple paths to a single cart or multiple paths to a single thank you/order confirmation page. By analyzing the session segment you easily determine which steps are succeeding vs which are failing and from there optimize your funnel and your marketing.
By building your session segment using Analytics Canvas and GA4 BigQuery, you are futureproofing your reports. This approach ensures that your reports are not subject to GA4 UI and API data retention limitations, data sampling, data thresholding, or data cardinality issues. By documenting your workflow in Analytics Canvas, you can share your business logic with your colleagues and clients, and update it quickly and easily. You can also run the workflow to update it with fresh data either on-demand or on a schedule.
Other Helpful Information
Event Local DateTime and Google Analytics 4 Batching
In Google Analytics 4 when events occur they are not immediately sent to Google Analytics 4 and/or BigQuery, Google does something called Event Grouping and writes the events to Google Analytics 4 and/or BigQuery in batches. You can learn more about batching at Google Support Page on Events, see section on Understand event grouping. Per Google documentation batching is not applied to Key events, such as purchase.
This means the eventLocalDateTime for some events will be the same, as the eventLocalDateTime is determined when the data is writing to GA4 and/or BigQuery not when the event is collected. In our use cases this did not impact our GA4 segment in BigQuery and we take this in account in our logic mentioned above when we build our segments.
However, if you want to use the exact time the event occurred and not the time it was written to Google Analytics 4 and/or BigQuery, it is recommended to create a custom event parameter in Google Tag Manager for all your events. You can learn more about how to set that up in Simo Ahava’s article on How Do I Access The Individual Timestamp Of A GA4 Event?
Note: You don’t need a custom event timestamp to implement our GA4 Ecommerce Segment solution.
Comparing Your Segment Result to GA4 Funnel Exploration
When working with GA4 and BigQuery, many compare BigQuery results with those from the GA4 UI/API. However, these usually won’t match because BigQuery exports raw event data, while the GA4 UI/API uses aggregated data. Additionally, GA4 UI/API results may be influenced by data retention limits, sampling, thresholding, cardinality, and consent mode. To learn more about why GA4 UI and BigQuery do not align, we recommend reading Google article on Bridge the gap between the Google Analytics UI and BigQuery export.
It’s also important to note that GA4 segments in Funnel Exploration count “Active Users,” while BigQuery segments typically count sessions. See image below:
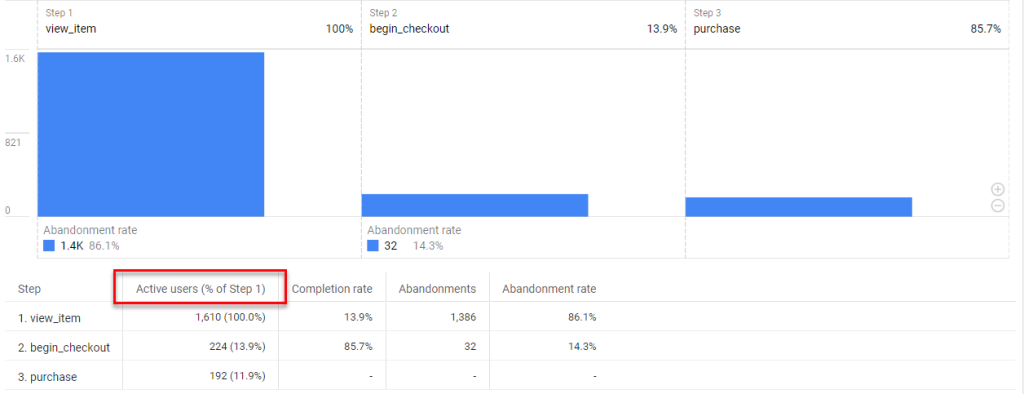
Per Google Support Page, “Active users” are the number of people who engaged with your site or app in the specified date range.
This difference means BigQuery often shows higher numbers, especially for the first funnel step, as users can perform an initial action multiple times (e.g., view_item) before proceeding (e.g., add_to_cart).
For a detailed explanation, refer to Google’s article on bridging the gap between GA4 UI and BigQuery exports. Instead of trying to match BigQuery results with the GA4 UI, focus on whether BigQuery provides meaningful trends.
Next Steps
Whenever you’re ready… here are 3 ways Canvas can help you with your GA4 Ecommerce Segment:
- Use Analytics Canvas – Google Analytics 4 BigQuery Event Export connector to build your first query
- Using our Transform blocks to quickly build your GA4 Ecommerce Segment
- Export your final Session Segment Table to Looker Studio to visualize for your client/stakeholders
Ready for the next step?
- Start an instant 30 day risk-free trial. No credit card or sales call required.
- Schedule a demo for you and your team.
- Contact us to discuss plans and pricing or activate your subscription.
Wondering if Canvas is right for you? Check out the related articles to learn more about our Data Studio Partner connector.
About the Author

Manisha Mistry is a Technical Marketer who blends her skills in project management, security, process development, e-commerce and data analytics into effective automation and measurement marketing. With a knack for solving complex data challenges, she uses tools like Analytics Canvas, GA4, GTM, and BigQuery to deliver meaningful dashboards to clients. Driven by her passion for technology, she is always learning, especially in areas like process automation and artificial intelligence. Manisha is currently working as an Instructor & Technical Marketer at MeasurementMarketing.io.